20+ Informative and Well-Designed Infographics
It’s impossible to comprehend complex data or analyze large amounts of information if we only use words or texts. Information graphics or better known as infographics are visual explanation of data, information or knowledge. These graphics are excellent visual tools for explaining huge amounts of information where complex data needs to be explained immediately and clearly. Let me show you how Rick Mans explains how infographics ease the process of communicating conceptual information.
Infographics is one of the most challenging types of graphic design because the creation process alone is pretty intensive. Researching data is a very lengthy procedure of getting information that takes both your time and dedication to obtain resourceful and correct data. After that, the designer must be able to create a strong visual impact that precisely displays the information in a way that is rational and blend with the overall design.
We are truly delighted to show you these brilliant and informative infographics created by various talented individuals. Here’s a collection of 50 infographics that are creatively designed, colorful, lively, shocking, and educational. Let’s have some visual feast!.
20+ Best Infographic Tools
Infographics tools help you turn boring data into vivid charts and graphs within minutes, and with minimal effort. Read more
Disney vs Marvel
A collage assignment made by Curseofthemoon. An infographic about Disney buying Marvel.

Relief Wells & Subsea Containment
BP intends to drill two wells designed to intersect the original wellbore above the oil reservoir.

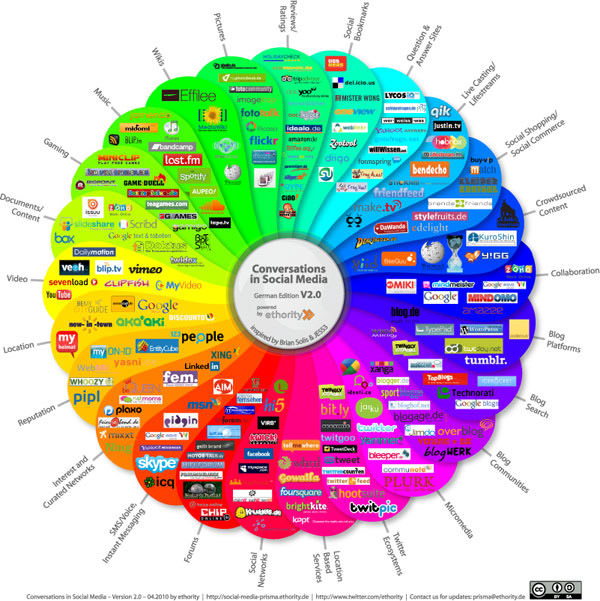
Prism Social Media 2010
This infographic display online conversations between the people that populate communities as well as the networks that connect the Social Web.
Flickr User Model
Bryce Glass has developed wonderful Flickr user model diagrams where one can simply understand the Flickr ecosystem.

Choose Your Weapon: The Global Arm Trade
World military spending has now reached one trillion dollars.

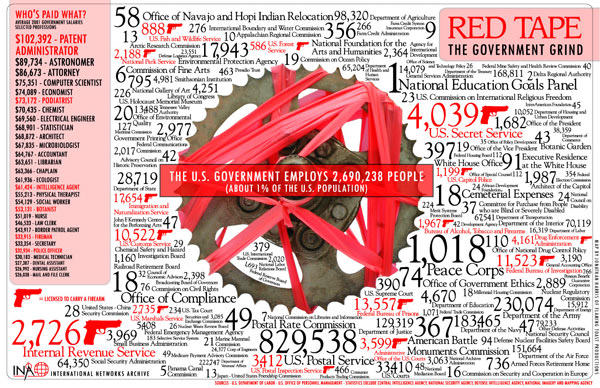
Red Tape: The Government Grind
US government average salaries and positions illustrated.
Twitter Users Profile
The different types of Twitter users.

The Kulula Airlines
African airline Kulula undergoes an entire fleet redesign. They made one big infographic on the exterior of their aircraft.

The Pyramid of Internet Piracy
MPAA provides a visual explanation of the pyramid of online piracy.

The Slowest Loading Websites in the Fortune 500
This infographic details the load times of all Fortune 500 companies.

Ancient Hebrew Cosmology
The ancient Hebrew conception of the universe.

Rocket-Proof Obamamobile
A cutaway illustration by John Lawson showing how tough Obama’s new Cadillac One.

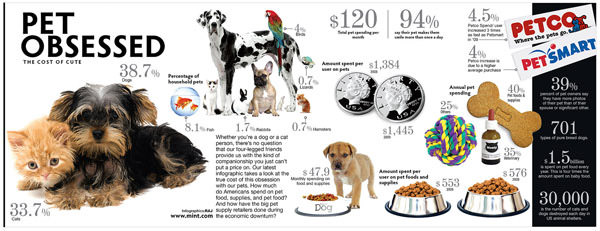
Pet Obsessed: Cost of Cute
Let’s take a look at the true cost of raising(and pampering) our beloved pets.
The D-Day
A detailed visual on what happened on D-Day.

Pikes Peak Course
A beautiful illustration for the Pikes Peak International Hill Climb.

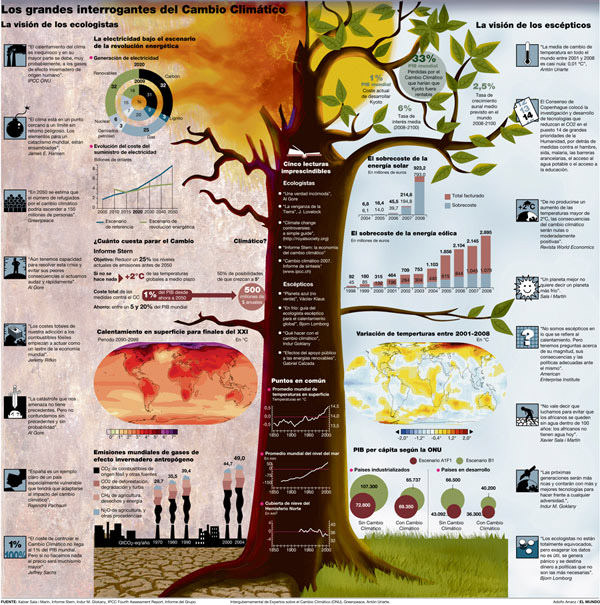
The Big Questions of Climate Change
The true impact of climate change.
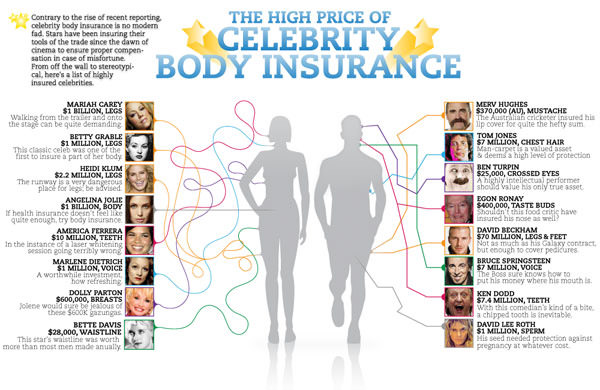
Celebrity Body Insurance
List of some popular celebrities and the body part they insured.
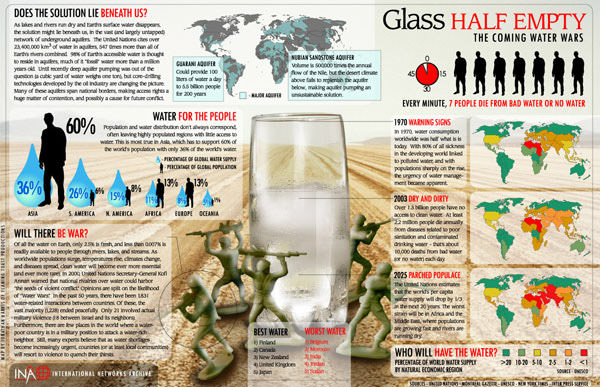
Glass Half Empty: The Coming Water Wars
This infographic explains why we need to save water now.
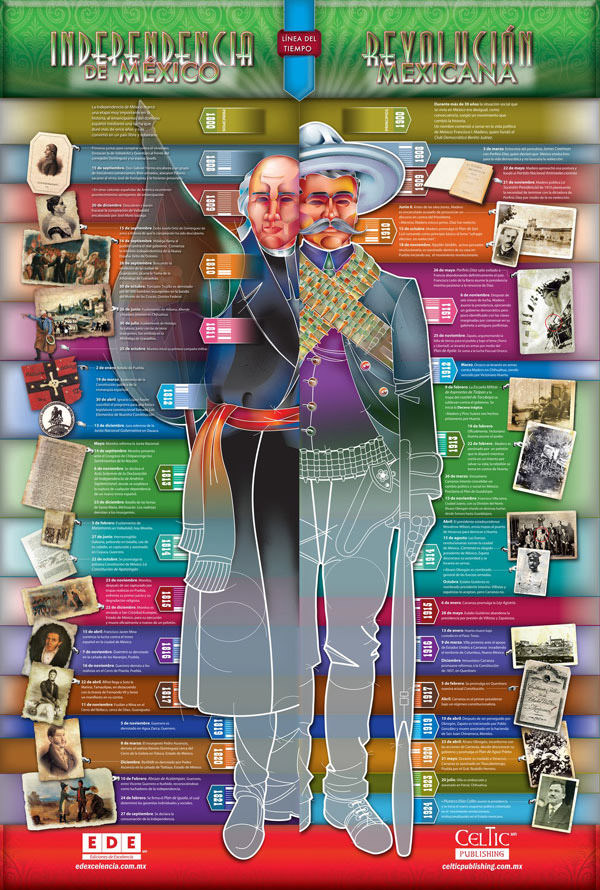
Bicentenary Timeline
Illustration and Design for Fernandez Editores.
The Killing of Puerto Hurraco
Infographic made for the Spain of Democracy.

Pyramid of Capitalist System
Capitalist explained on this simple but visually appealing infographic.

LEGO Brick Timeline: 50 Years of Building Frenzy
LEGO, through the years.

Humans vs Animals
This interesting infographic shows that some purely human traits are found in animals.

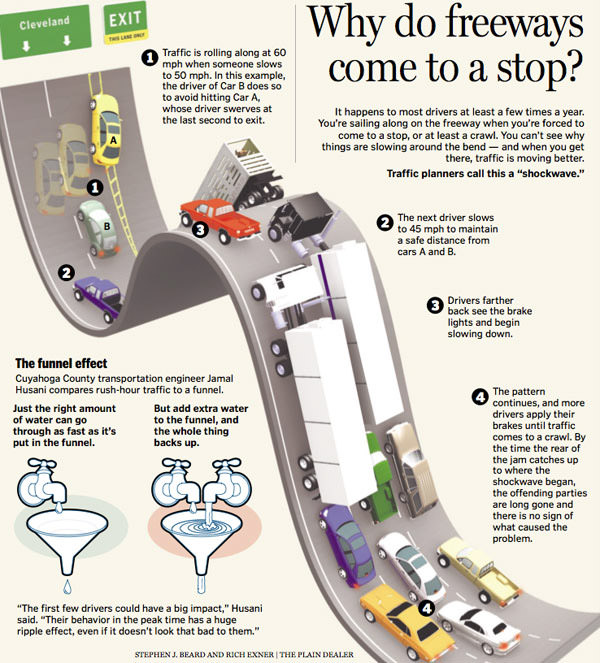
Why do Freeways Come to a Stop
This cool infographic provides four reasons why freeways come to a stop.
The Giant Panda
A creative infographic displaying a portrait of a panda through typography.

Figurinhas da Copa
A special magazine series for star players going to the World Cup.

Transito 3 final
Infographic about what causes more traffic accidents.

The Biggest Shift
Assuming these statistics are logically accurate, they highlights the significance and magnitude of social media.
