How to Start Using Chrome Developer Tools for Web Design
Editor’s note: For an updated version of this post, check it out here.
Google Chrome has quickly gained significant market share in the browser niche and is equipped with a handy tool for developers.
In this post, we’ll explore Chrome Developer Tools and how you can leverage its features to streamline your web development process.
To access Chrome Developer Tools, navigate to Tools > Developer Tools.
You can also right-click on any webpage and select Inspect Element. If you’re using Google Chrome on Windows, simply press the F12 key.
Using the Elements Tab
The Elements tab allows you to view the webpage’s markup and the styles affecting the page. This is particularly useful for inspecting and troubleshooting HTML and CSS issues.
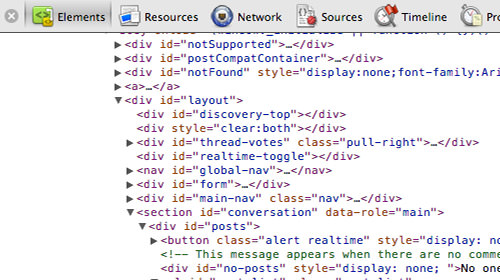
Editing Document Structure
By right-clicking on an element, you can easily add, edit, and copy attributes, as well as edit the HTML markup. You can also view the element’s state under :hover, :focus, and :active conditions.
This feature is especially useful when you need to make changes but don’t have direct access to the source files. For example, I’ve used this when helping a friend debug their webpage.
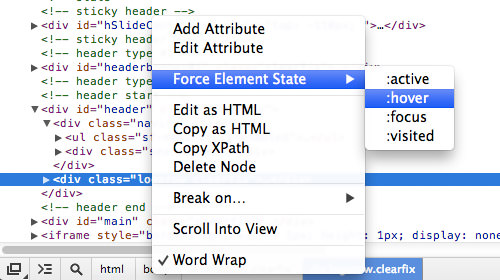
You can also drag and drop elements to see how changes affect the layout. In the example below, we slightly adjusted the Facebook header structure to see the impact.

Editing CSS
When you select an element, the styles affecting it will be displayed on the right. You can add or remove styles directly from this panel.
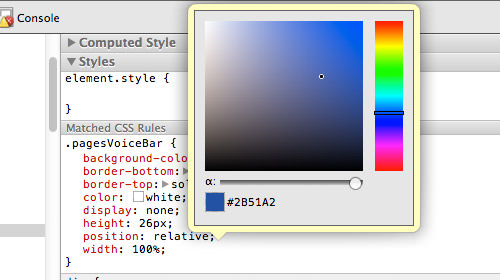
Chrome Developer Tools also includes a built-in color-picker. Click on any color box to adjust the colors seamlessly.
By default, colors are shown in Hex format, but you can easily switch to RGB or HSL formats by clicking on the Settings icon in the Styles tab.
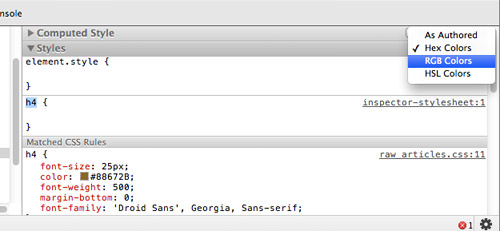
You can then choose the color format that best suits your needs.
Adding CSS
To add new styles, select the HTML element you want to style, then click the plus (+) icon in the Styles tab. This will automatically generate the appropriate selector.
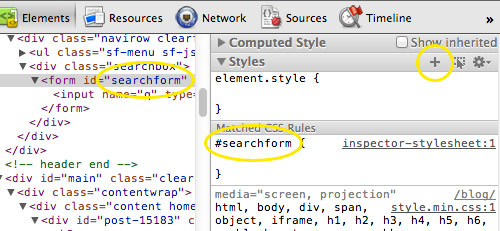
You can now add styles directly from your browser.
Using the Console
The Console tab displays log events such as errors and warnings, helping you troubleshoot issues with your website.

If you’re working with jQuery, you can use console.log to log script events. For example, the following script captures the value of an input element and sends it to the Console for verification:
HTML
<input type="text" value="Hi There!">
jQuery
var val = $('input').val();
console.log(val);
Upon reloading the page, the Console will display the result.

Changing User Agent
If you’re developing a website, you may want to see how it renders on different devices. Chrome Developer Tools allows you to change the User Agent to simulate different environments.
To do this, click the Settings icon at the bottom right of the Developer Tools window. An overlay will appear, like this:
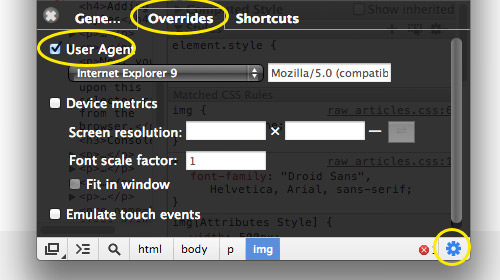
Next, navigate to the Overrides tab. Here, you can select from a list of predefined User Agents for devices like iPhones, Android phones, and Blackberries.
If you need a specific User Agent that isn’t listed, you can find it on the User Agent String page.
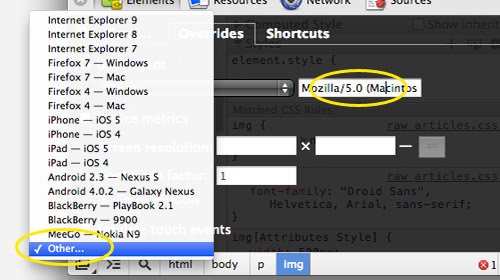
Simply select Other from the list and paste the copied User Agent into the input field.