How to Enable Chrome DevTools App for Remote Debugging
The Chrome DevTools App was created by Kenneth Auchenberg to bring devtools out of the Chrome browser. This application is based on NW.js and works on Mac OS X, Linux, and Windows.
The developer’s vision is to offer remote debugging across multiple browsers from a single unified platform. While this concept will take time to gain popularity due to various reasons (and resistance, as detailed in his blog), it’s a promising development for developers.
In this article, we’ll explore the Chrome DevTools App and what it offers to developers.
More on Hongkiat:
- Getting Started with Chrome Developer Tools
- 5 (More) Useful Chrome DevTools Tips for Developers
- How to customize Google Chrome DevTools theme
Installation
Download the Chrome-Devtools.app.zip and extract it. Double-click to run. Start your Chrome Browser and enable remote debugging.
On a Mac, open the terminal and run the command below:
sudo /Applications/Google\ Chrome.app/Contents/MacOS/Google\ Chrome --remote-debugging-port=9222
On Windows, open the Command Prompt and use this command:
start chrome.exe --remote-debugging-port=9222
How to Use
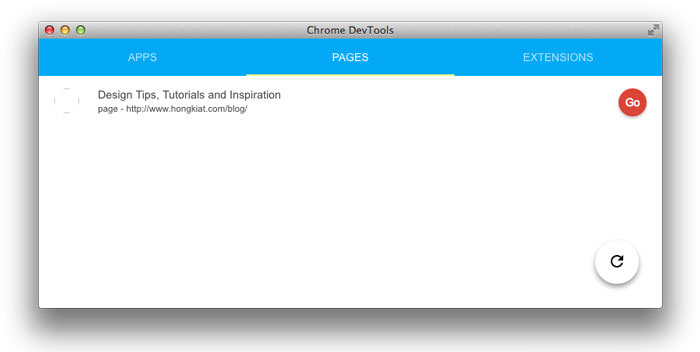
With Chrome open and remote debugging enabled, browse to any site. For this example, we used Hongkiat.com. Then, go to the Chrome DevTools app window and refresh the list (button at the bottom right).
You will see the Hongkiat.com link listed (as shown below).

Now, click the ‘Go’ button. This will open a new window. The Chrome DevTools app is now running. It functions just like the “inspect element” feature in the Chrome browser.

You can use the Chrome DevTools app just like the native DevTools in Chrome: inspect DOM elements, debug JavaScript, work with the Console, and more.
What’s next?
This app is still experimental. However, taking the DevTool out of Chrome allows developers to use it as a functional editor and work with other runtimes like node.js and iOS. For more possibilities, check out Auchenberg’s thoughts here.