Firefox Developer Edition: 6 Coolest Tools to Try
Firefox developer edition is the only browser today that is made especially for developers. The developer tools in the standard edition appears first in the developer ‘s edition and there are tools in developer edition that aren’t and won’t be made available in the standard edition. Today we’re going to take a look at some of the tools that at the moment can be found only in the developer edition.
If you’re someone who has never used or who isn’t very familiar with developer tools even those in the standard edition, check out this cool "DevTools Challenger" by Mozilla first. Here you can practice with some of the tools mentioned below in the Firefox developer edition browser. The examples are fun and easy to follow, the instructions straightforward and if you can’t catch up, just follow the video tutorial instead.
1. Animation inspector tool
CSS animations are becoming more and more common, and the CSS animation tools provided by the Firefox developer edition makes it easy to follow and inspect every step of the animation created. You can pause, play and reverse any animation; you can also view it happening frame by frame via scrubbing.
To access the tool, open the Inspector tool by right clicking on the animating element and selecting "inspect element", then at the right side of the dev tool window, click "Animations".

2. Animation timing function editor
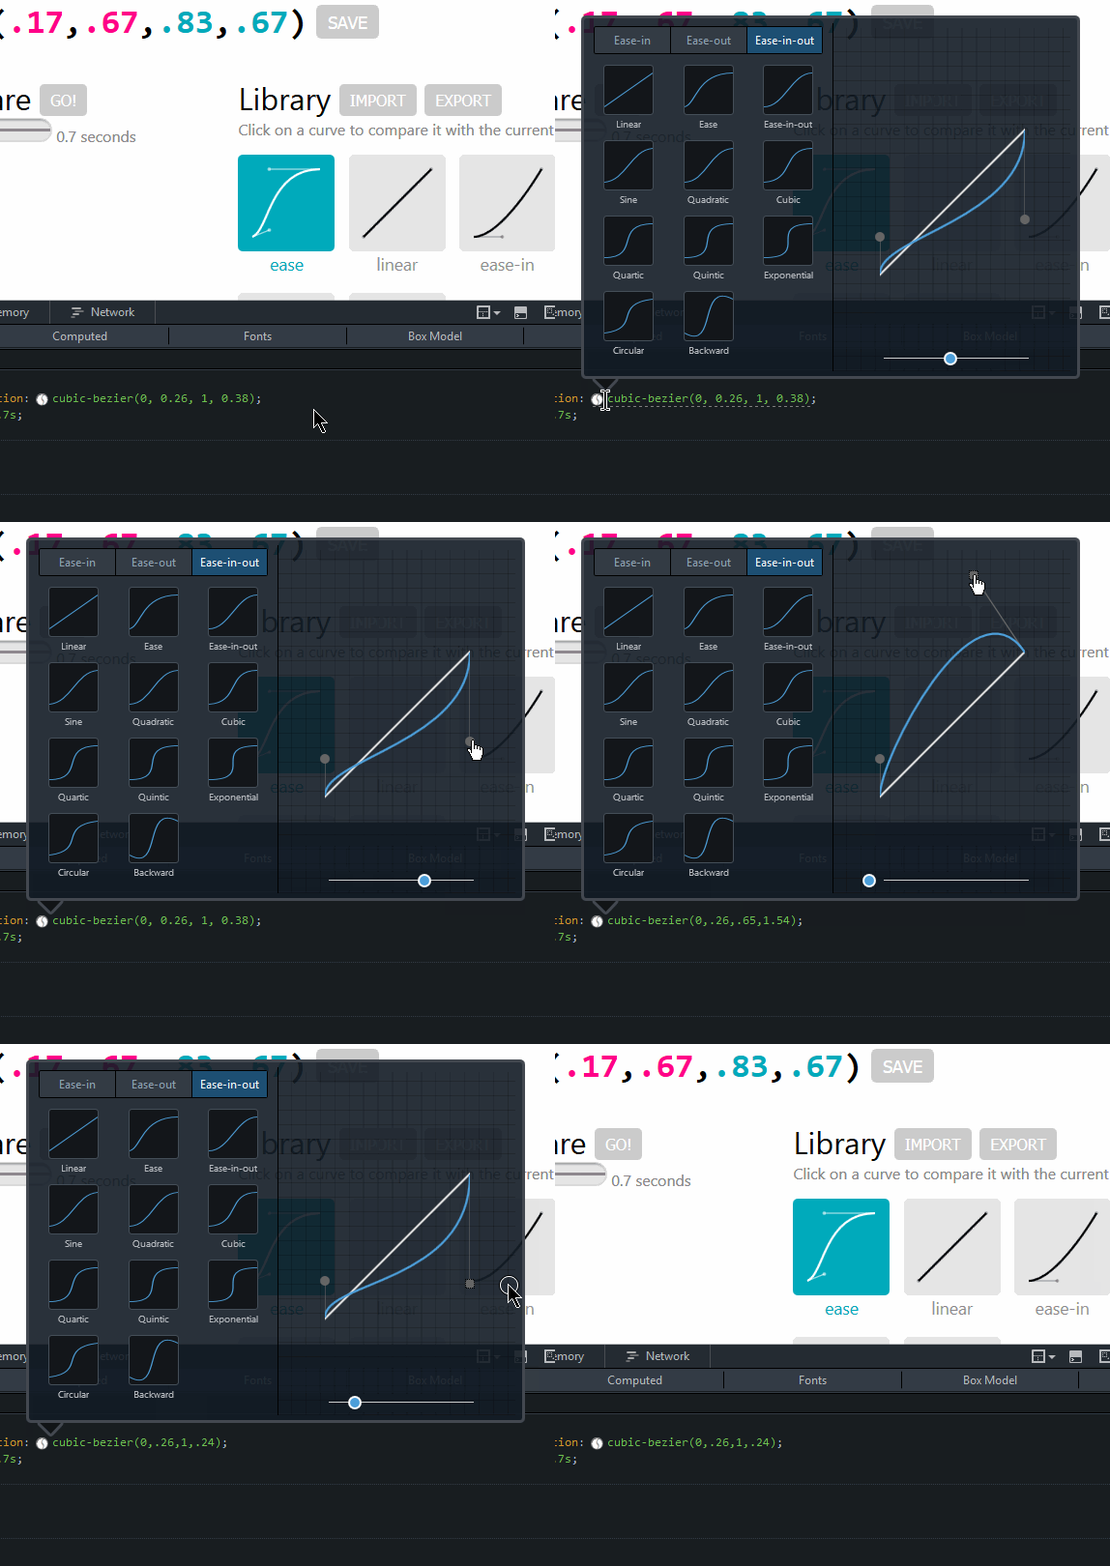
The animation timing is editable in the dev tool, you simply click the icon beside the function in the Rules section of the Inspector tool and a pop up showing the function curves opens up. You can drag and modify this to adjust your animation timing. Once you’ve made the changes to the curves, your animation speed will change accordingly.

If you aren’t already familiar with the cubic Bezier animation function, I recommend this post to learn more about it.
3. Color Picker for CSS Properties
There’s already a color picker available in the standard edition of the Firefox (read more about it in this post), which picks a color from the page and copies it to the clipboard. The color picker I’m mentioning now however is specific for the CSS color values of the properties.
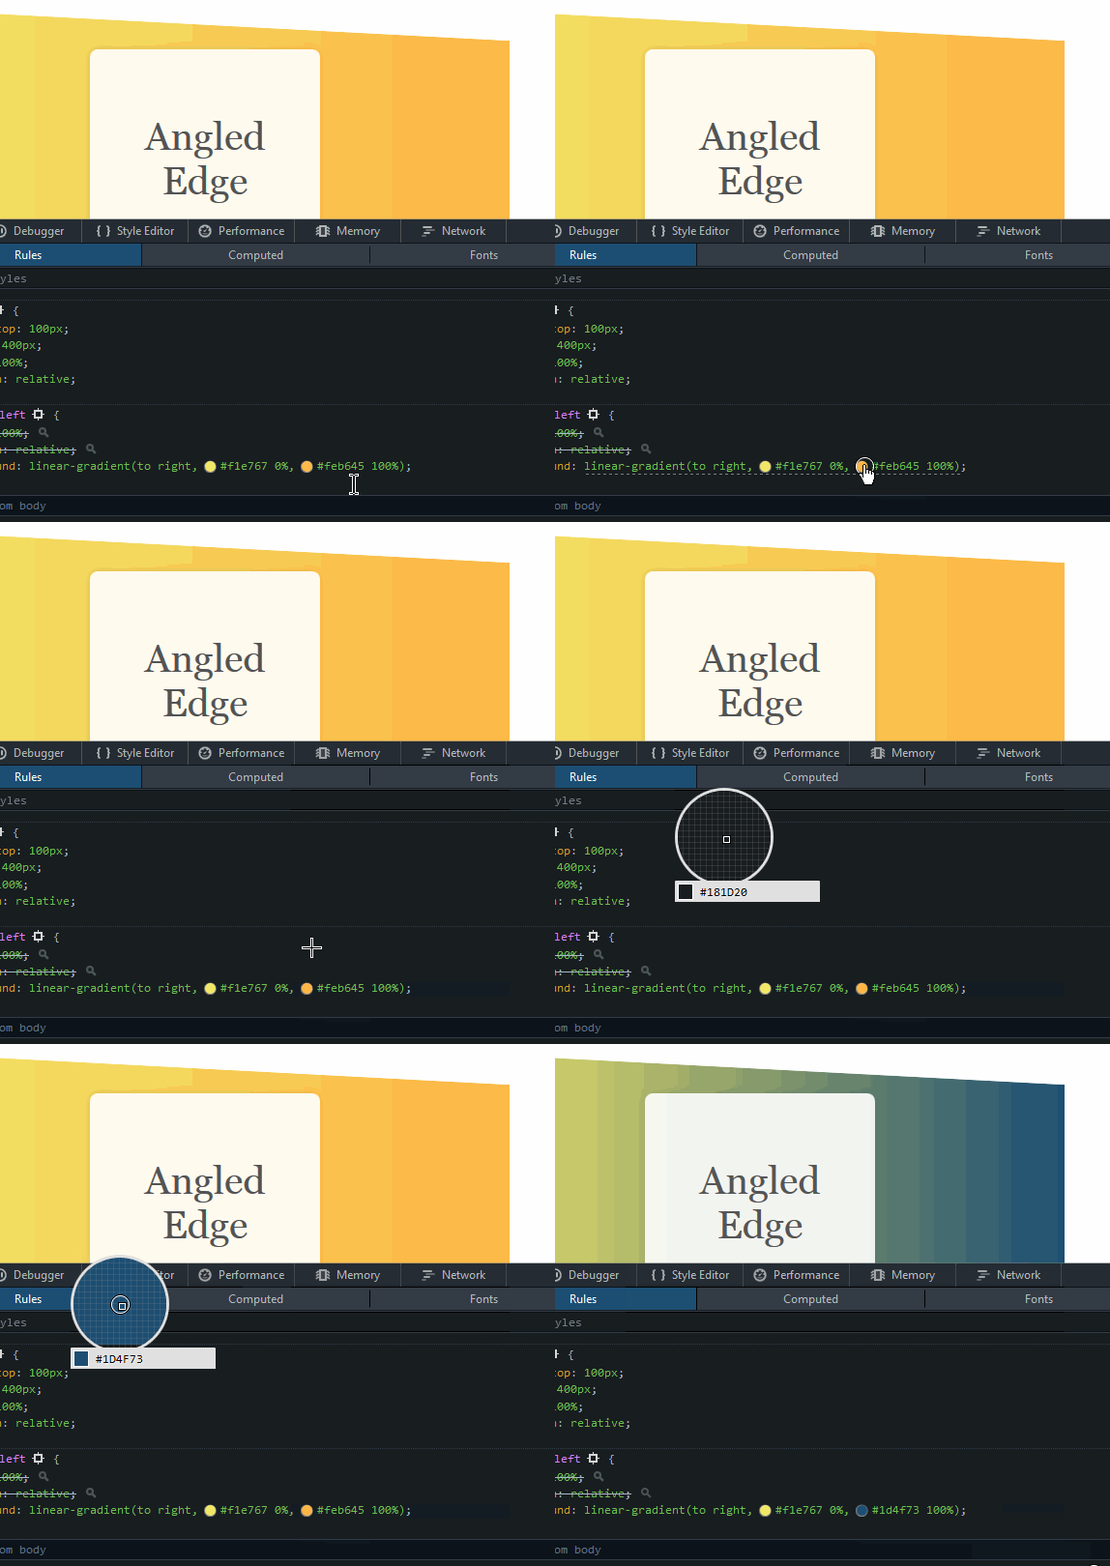
Beside every CSS color value in the Rules section of the Inspector tool, there’s an icon which will open a color wheel pop up when clicked. You can select which color you want from the wheel.

If you already have a color you want, and one that happens to be on the page, simply click the eyedropper tool at the bottom of the popup to open the color picker, then drag the picker to the color you want, and click on it. The CSS color value will be changed to that of the selected color.
4. Measuring tool
This tool lets you see the XY position of the cursor ,and height, width and diagonal measurement in pixels of a selected portion. To use the tool, you’ll have to first enable it in the developer Toolbox Options, by checking the checkbox named "Measure a portion of the page" under "Available Toolbox Buttons".
Once enabled, a ruler icon will appear at the top of the dev tool window, click that icon and move the cursor over the page. You’ll see the XY positions near the cursor. To measure the width, height and diagonal just click and drag to select the portion you want to measure.

5. CSS filter editor
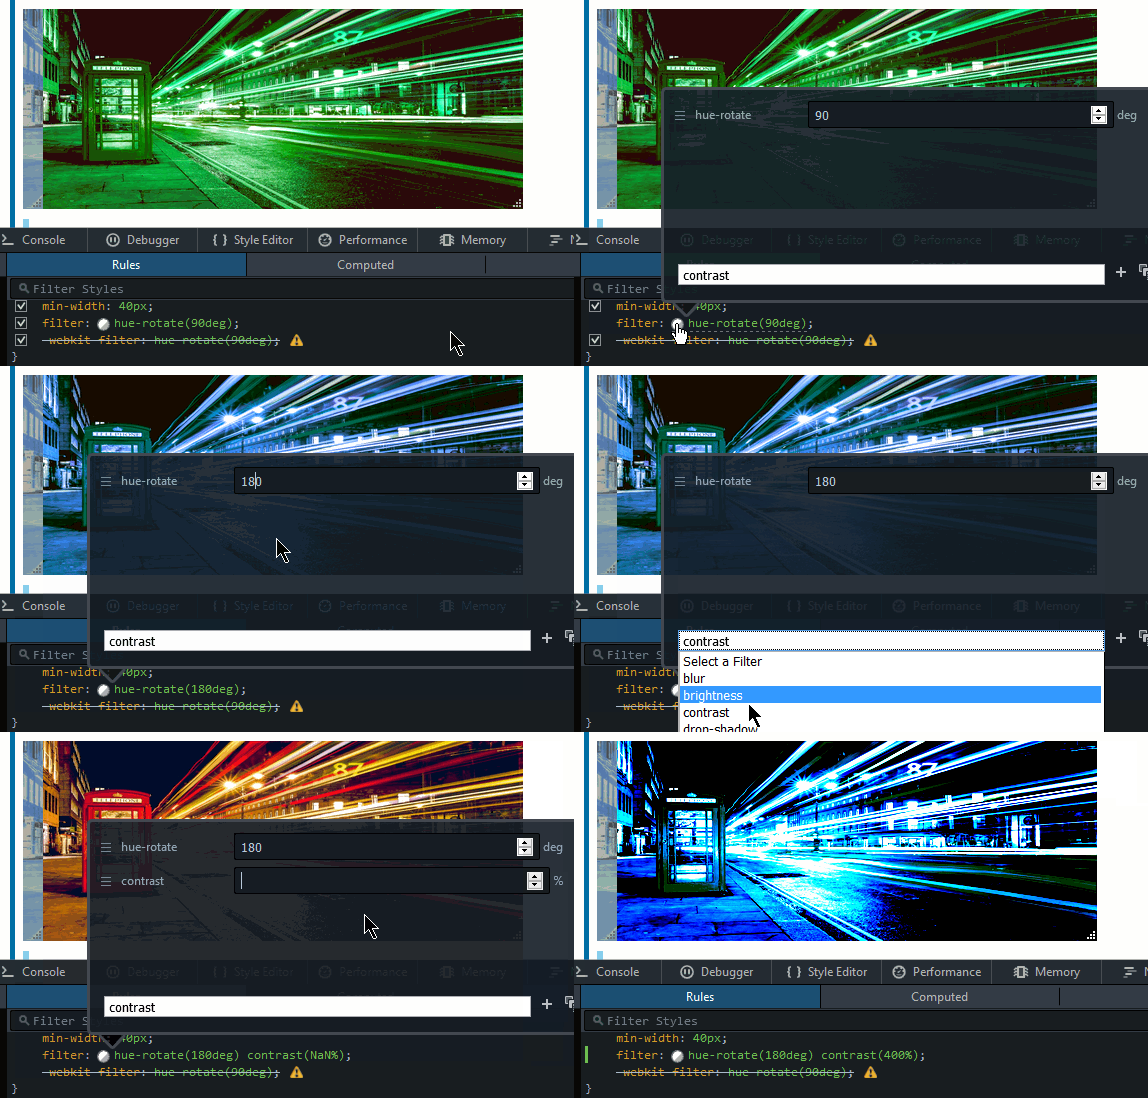
If you’d applied CSS filter to an element on the page, you’ll see an icon beside it in the Rules section of the Inspector tool, which opens up a CSS filter editor upon click.
To remove a filter, click the × mark at the right end of the filter name. To add a filter, click the filter box at the bottom and select the one you wish to add and click the + sign. You can also rearrange the filters into any order by dragging each item.

6. Memory tool
You can find out what is taking up the memory in your web page, with the help of this tool. This helps you take steps to lower memory usage and improve your page speed consequently.
To use the tool, you’ll have to enable it first from the Toolbox Options by checking the checkbox named "Memory" under "Default Firefox Developer Tools". Once checked, you’ll see the "Memory" section at the top of the dev tool window right after "Performance". Select that.
To use the tool, click on "Take snapshot" or the camera button. You’ll see a list of items, like objects and scripts that are taking up memory .
