20 Powerful VS Code Extensions for Front-End Developers
Visual Studio Code, Microsoft’s powerful code editor, has quickly become a favorite in the developer community. The editor’s versatility is significantly enhanced by a wide array of extensions available in the Visual Studio Code Marketplace. These extensions are particularly beneficial for web developers, offering tools and features that streamline various aspects of coding and development.
In this post, we delve into the world of VS Code extensions, specifically focusing on front-end development. After exploring numerous extensions, I’ve curated a list of those that stand out for their intuitiveness, ease of use, and convenience. While this list is informative, the marketplace is constantly evolving with new and improved extensions, so I encourage you to explore it further and discover the tools that best suit your development needs.
How to Install VS Code Extensions?
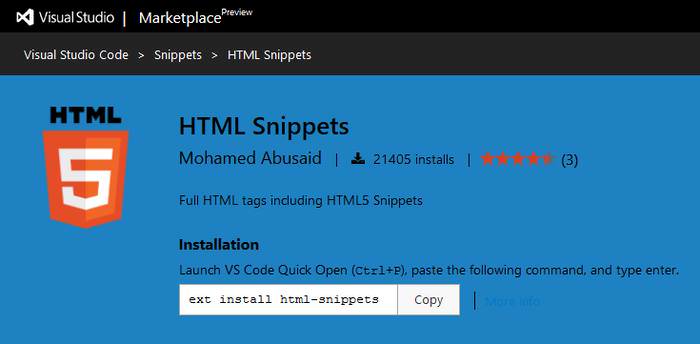
Installing an extension is pretty straightforward in Visual Studio Code, as you can do it within the code editor. In the VS Code Marketplace every extension has its own page, and you can find the command you can install the given extension with on top of this page.
The command always begins with the ext install term. To install an extension, just press CTRL+P inside VS Code to start the Quick Open panel, copy-paste this command into it, and finally restart the code editor to make the new extension work.
Useful VS Code Extensions for Developers
HTML Snippets
If you want to frequently write HTML in Visual Studio Code, the HTML Snippets extension can come as a handy tool, as it adds elaborate support for HTML. Although VS Code has basic support for HTML, such as syntax colouring, the HTML Snippets extension knows much more.
Probably the most useful feature of this extension is that when you begin to type the name of an HTML tag (without the starting angle bracket), HTML Snippets quickly displays a list of the available options with a short information about each.

When you click on the element you need, HTML Snippets adds the full HTML5 tag with its most common properties. For instance, if you want to add a link (anchor tag) to your document, just type an a into VS Code, choose the right option in the popup box, and HTML Snippets will insert the necessary <a href=""></a> snippet into your editor without any hassle.
The author of this extension also pays attention to remove deprecated elements, so if you want to use an HTML tag that you can’t find in the popup list, it’s worth to check out whether it’s still valid or not.
turbo-console-log
Ever found logging messages a bit tedious? The turbo-console-log extension is here to help. It makes creating log messages a breeze. Just choose the variable you want to check and hit Control + Alt + L.

Voila! A detailed log message appears right after. It’s not just about adding messages; you can quickly comment, uncomment, or delete all logs in your document, making your coding smoother and more productive.
Prettier
Meet Prettier, the code formatter that cares about consistency. It’s like having a strict editor for your code, ensuring everything looks uniform. As you save, Prettier takes over, parsing and reformatting your code to follow set rules.
It considers line length, wraps code neatly, and lets you choose which languages to format. Say goodbye to style inconsistencies in your code!
HTML CSS Class Completion
HTML CSS Class Completion can be a helpful extension if you need to use many CSS classes in your project. It frequently happens to us developers, that we are not completely sure in the exact name of a class, but it just sits at the back of our mind as passive knowledge.
This smart extension gives a solution for this problem, as it fetches the names of all CSS classes in the current workspace, and displays a list about them.
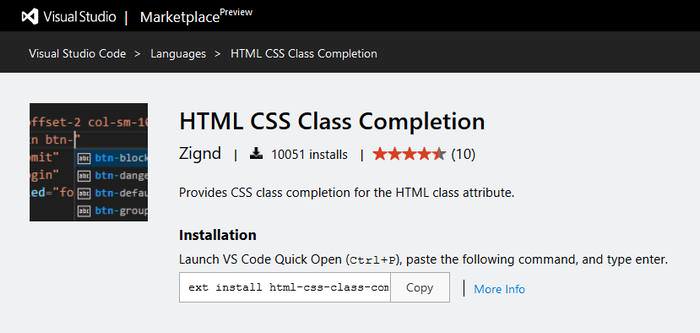
Let’s say, you want to create a site using Zurb Foundation, and you want to use the small grid. You don’t remember how the classes are exactly named, but you know they have semantic names.
With HTML CSS Class Completion you only need to start to type the word small, and the available options appear on your screen at once, so you can easily select the one you need.

Import Cost
Concerned about your code’s performance? The Import Cost extension is like a vigilant assistant, keeping an eye on performance as you code. It might not analyze your entire bundle, but it alerts you to heavy imports before they bog down your users.

As you bring in a third-party library, Import Cost shows its size right next to your code, helping you maintain a lean, efficient project.
VSCode Edge DevTool
The Microsoft Edge Developer Tools for Visual Studio Code seamlessly integrates the robust capabilities of the browser’s DevTools into the VSCode environment, particularly for Microsoft Edge users. This extension eliminates the need to switch between your code editor and the browser while working on a project.

With features like viewing and interacting with runtime HTML structure and modifying styling and layout, it offers an efficient way to handle diagnostics and debugging within VSCode.
GitLens
GitLens offers invaluable insights into your codebase. It helps you understand who made changes to the code, why, and when. The extension is great at visualizing code authorship, showing you the contributions of different team members at a glance.
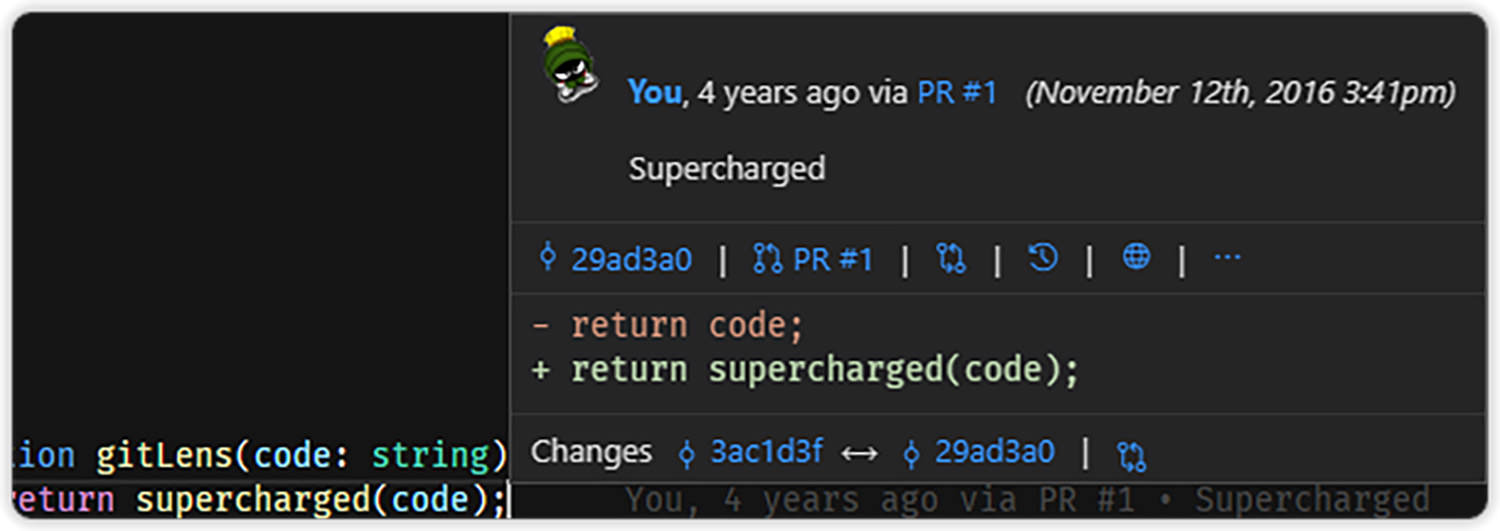
GitLens makes navigating and exploring Git repositories effortless, with features like comparison commands that provide a detailed view of changes and their impacts on your project.
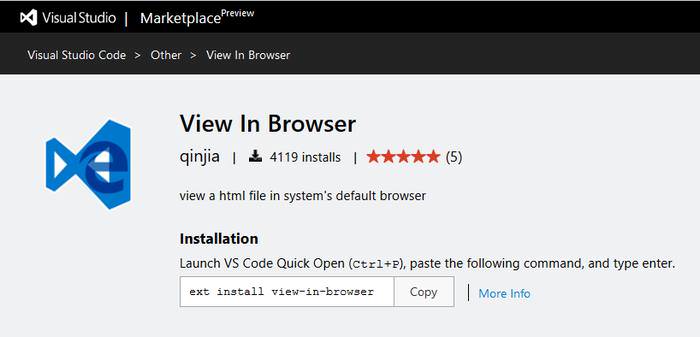
View in Browser
View in Browser is a simple but powerful extension for Visual Studio Code. It can facilitate front-end development by allowing you to have a quick look at the result of your work in the browser while coding. You can open your HTML file in your default browser directly from VS Code by pressing the CTRL + F1 keyboard shortcut.
Note that View in Browser only supports HTML, so if you want to see your site you need to have the HTML file open. You can’t directly access the browser from a CSS or JavaScript file.
VS Code Chrome debugger
The VS Code Chrome Debugger is a game-changer for developers who frequently debug client-side JavaScript. It allows you to directly debug JavaScript running in Chrome from your Visual Studio Code environment.

By using the Chrome Debugger Protocol, this extension seamlessly connects Chrome to VS Code, enabling features like setting breakpoints, watching variables, and viewing the call stack without ever leaving your editor.
File Utils
File Utils is a powerful tool that makes handling files in your editor a breeze. It lets you create, duplicate, move, rename, and delete files and folders with simple commands.
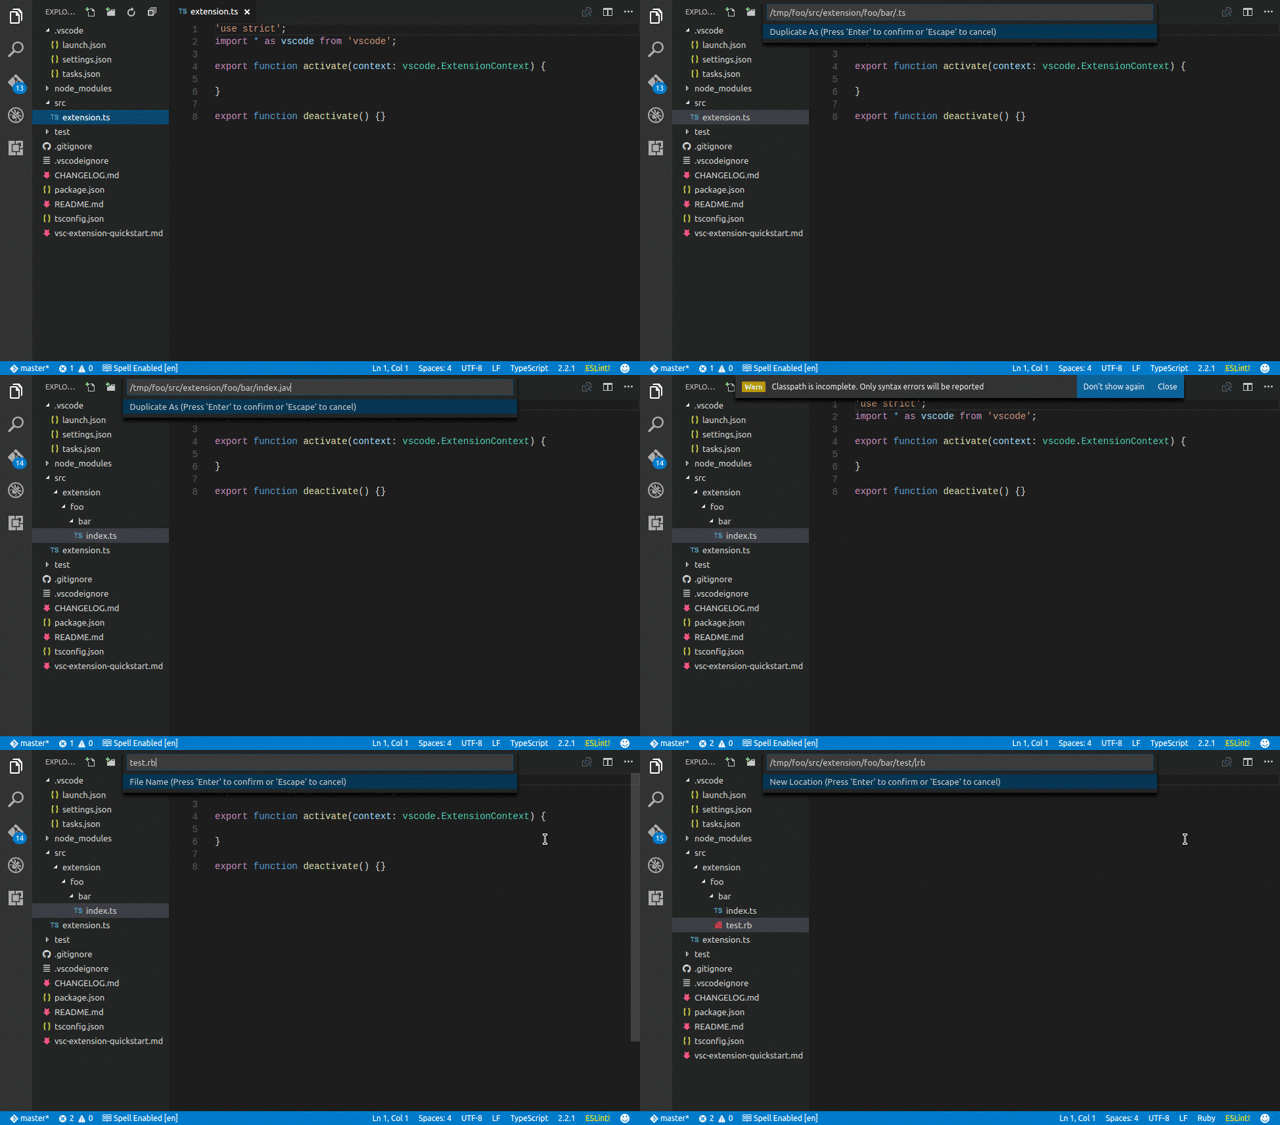
This extension is all about saving you time and effort in managing your project’s file structure. Plus, it features brace extension, which helps in quickly setting up complex document structures by automatically generating strings.
Debugger for Chrome
Debugger for Chrome was built by Microsoft itself, and it’s currently the 4th most frequently downloaded Visual Studio Code extension.
Debugger for Chrome makes it possible to debug JavaScript in Google Chrome without leaving the code editor. This means that you don’t need to work with the transpiled JavaScript the browser sees, but you can perform the debugging right from the original source files. See this demo to see how it works.
The extension has every feature a decent debugger needs, such as breakpoint setting, variable watching, stepping, a handy debug console, and many others (see the feature list of the first release).
To use this extension you need to start Chrome with remote debugging enabled, and set up a proper launch.json file. This latter may take for a while, but you can find detailed instructions on GitHub on how to properly do it.
File Ops
File Ops enhances your project organization by allowing you to add tags and aliases to files. This feature simplifies finding and switching between important files in your project.

The extension shines in keeping track of numerous files, offering a convenient way to list all tags. Additionally, it makes it easy to view and switch between related files in the same directory, like .css and .js files. An informative video is also available to help you understand all its functionalities.
Gremlins tracker
Gremlins Tracker is your go-to tool for spotting hidden or tricky characters in your code. It highlights characters like zero-width spaces and unusual quotation marks, which might cause unexpected errors.
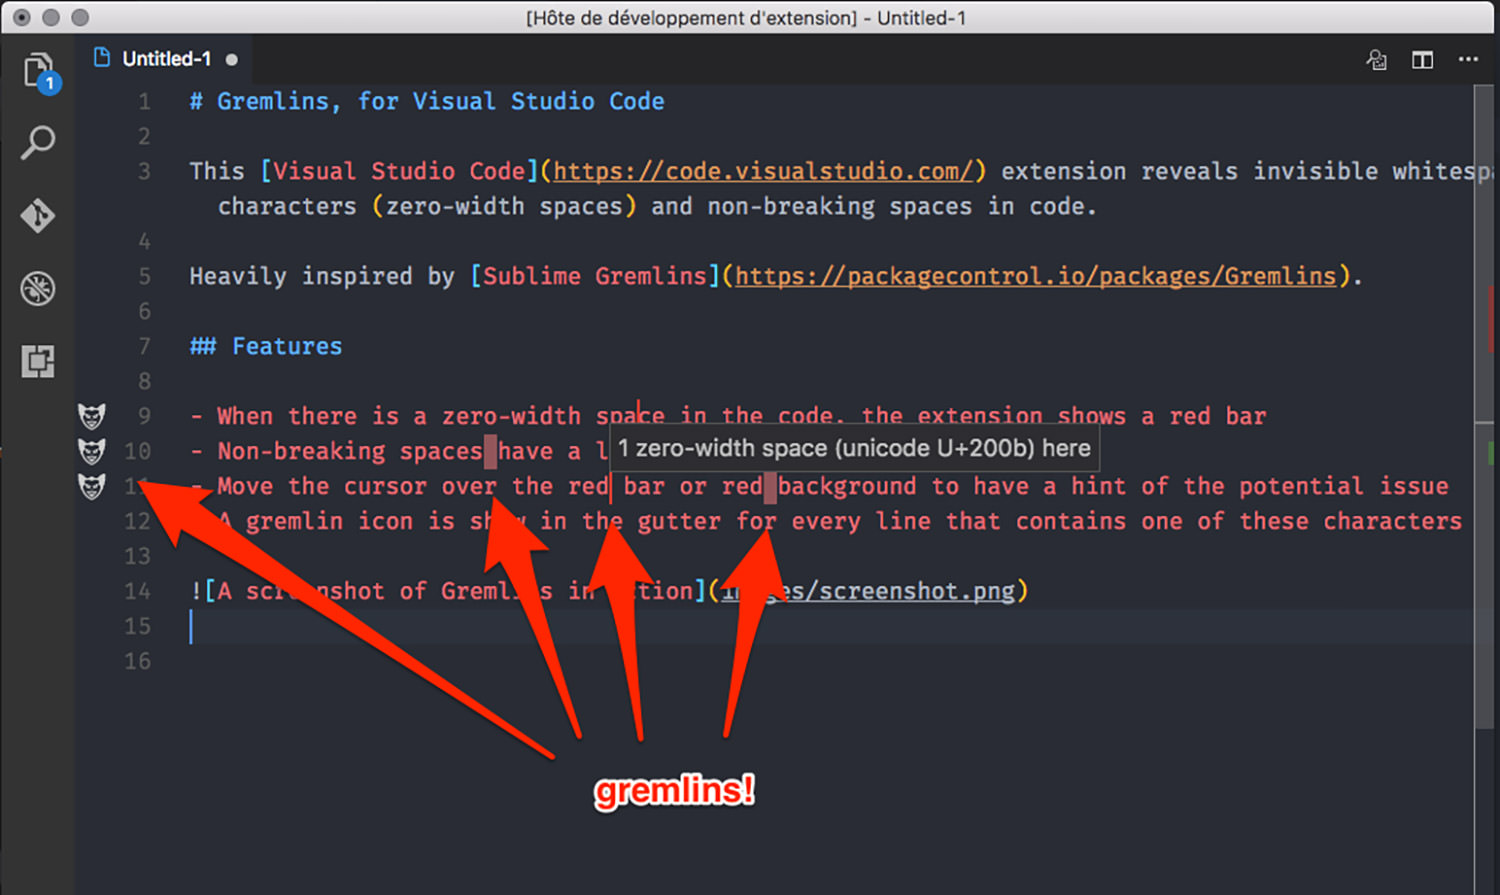
This tool uses a color-coded system to indicate the level of harm these characters pose. It also marks lines with a Gremlins icon and provides detailed hints about these characters when you hover over them, helping you maintain clean and error-free code.
JSHint
Visual Studio Code’s JSHint extension integrates the popular JSHint JavaScript linter right into the code editor, so you can be informed about your errors as soon as you commit them. By default, the JSHint extension uses the default options of the linter that you can customize with the help of a configuration file.

The usage of this extension is quite straightforward, as JSHint marks the errors with red, and the notifications with a green underline. If you want more information on the issues, just hover over the underlined parts, and JSHint will float a label with the description of the problem at once.

Polacode
Polacode transforms the way you share your code visually. It’s like a Polaroid camera for your code, simplifying the process of capturing aesthetically pleasing screenshots within Visual Studio Code (VS Code).

You can easily edit these screenshots right in the editor, adjust the size of the code container, and control the image’s appearance with handy commands. Polacode is ideal for presenting your code in the most visually appealing manner.
jQuery Code Snippets
jQuery Code Snippets can greatly speed up front-end development in Visual Studio Code, as it lets you quickly write jQuery without basic syntax errors. jQuery Code Snippets currently has around 130 available snippets you can invoke by typing the right trigger.

All jQuery snippets but one start with the jq prefix. The one exception is the func trigger that inserts an anonymous function into the editor.
This handy extension is a convenient help when you are not completely sure about the proper syntax, and want to spare the time to check the documentation. It also makes it easy to quickly scroll through the available options.

Bower
The Bower VS Code extension can make your web development workflow more intuitive by integrating the Bower package manager into Visual Studio Code.
If you put this extension into use you don’t have to switch back and forth between the terminal and the editor, but you can easily perform your package management tasks right inside Visual Studio Code.
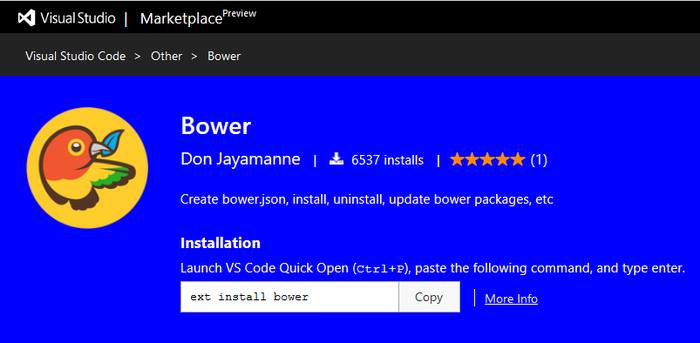
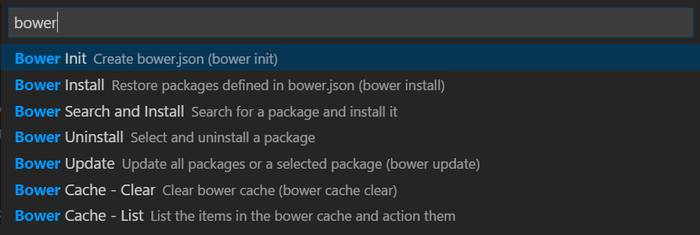
The Bower extension leads you through the creation of your project’s bower.json file, and you can also install, uninstall, search, update packages, manage cache, and perform many other tasks with it (see full feature list).
You can access Bower-related commands by starting the Command Palette by pressing F1, typing “Bower” into the input bar, clicking on the “Bower” option in the dropdown list that appears, and picking the appropriate Bower command.
Better Comments
Better Comments breathes new life into your code annotations, making them more user-friendly and visually distinguishable. This tool allows for easy categorization of comments into types like alerts, queries, todos, and highlights, helping you quickly identify the nature and importance of each comment.
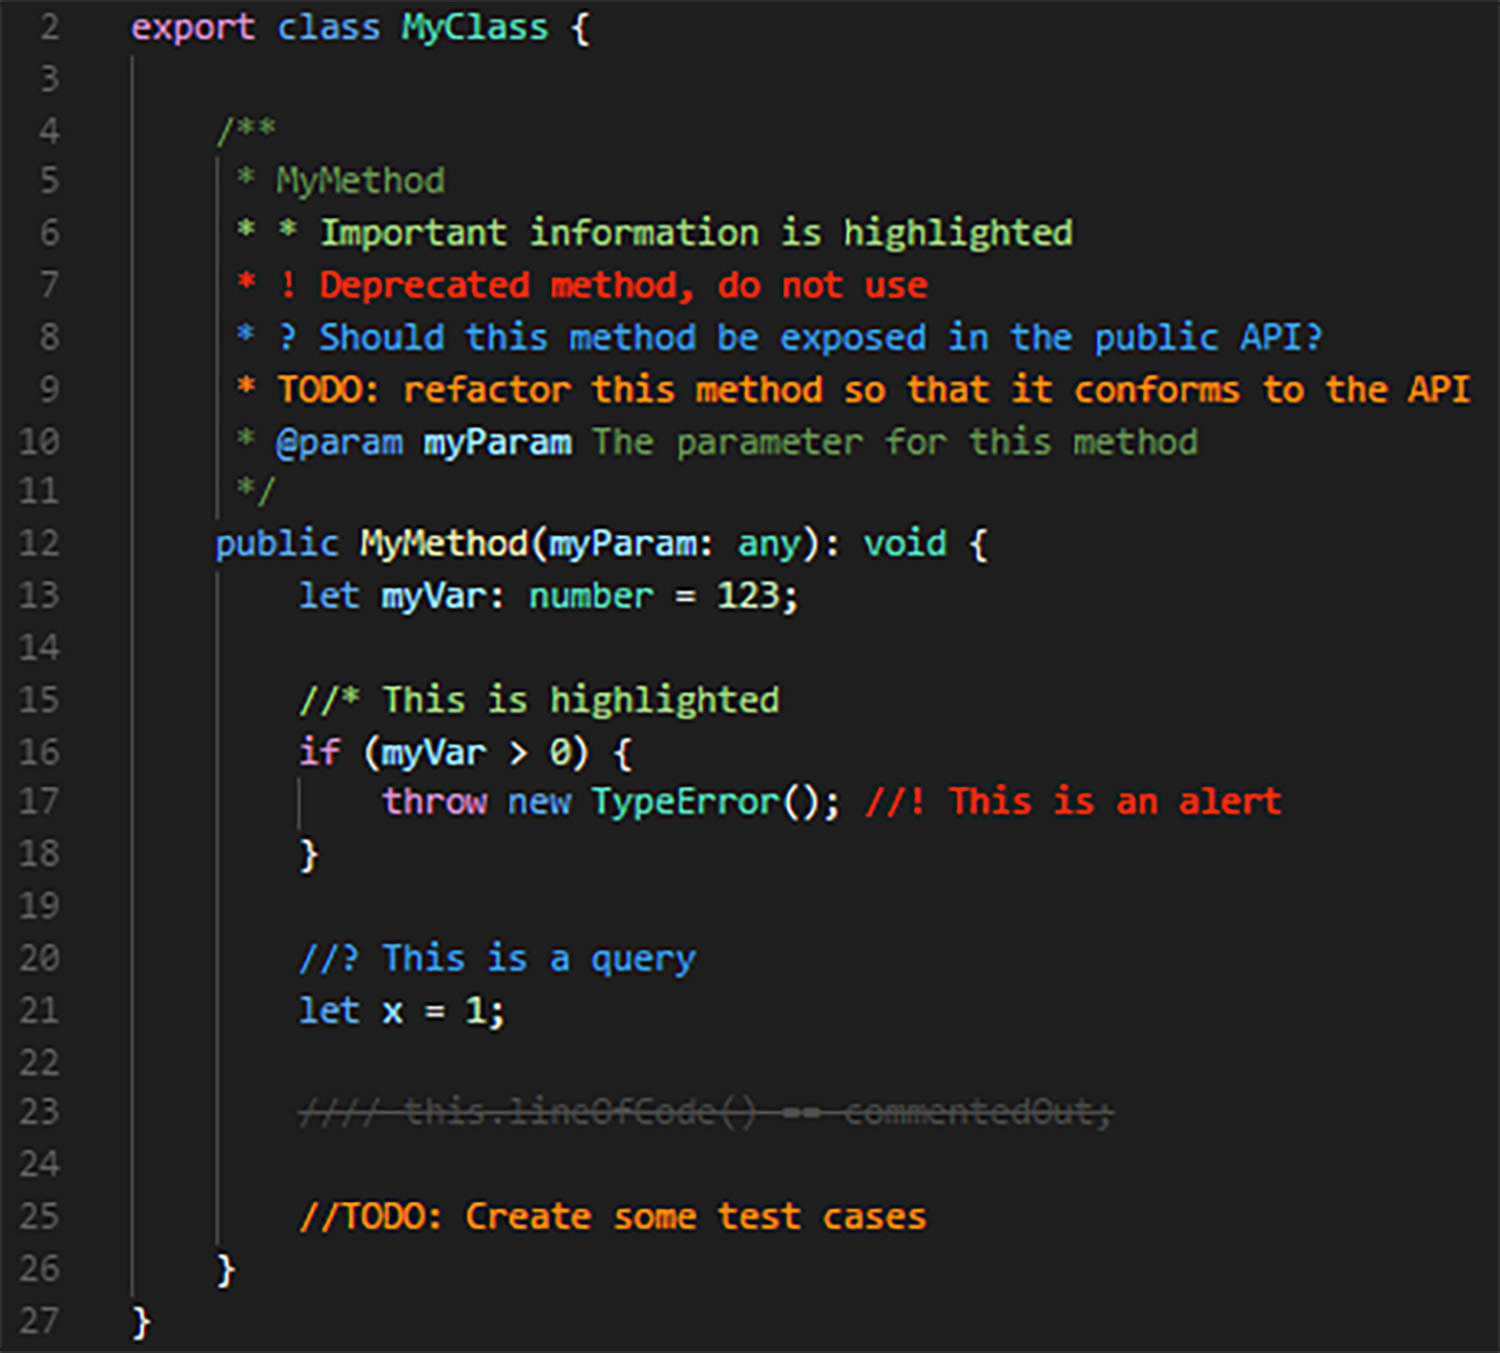
Whether it’s an alert about a deprecated method or a reminder about an incomplete task, this extension ensures clarity. It also offers styling options for commented-out code, aiding in maintaining clean and efficient code.
Git History
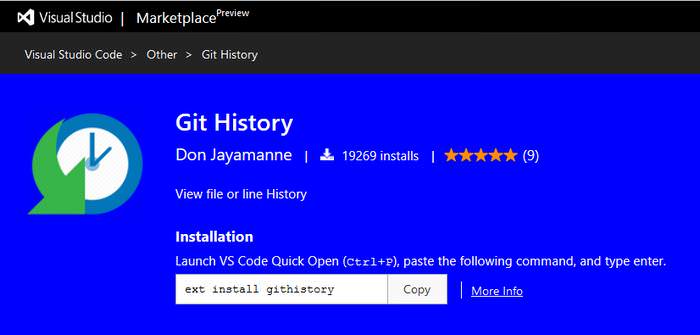
Git History makes it possible to follow the changes of a Git project inside Visual Studio Code. This extension is especially useful when you want to contribute to a bigger Github project, and need a way to quickly check out the modifications other developers made.
With the Git History extension installed you can view the history of an entire file, or a particular line inside of it. You can also compare previous versions of the same file.
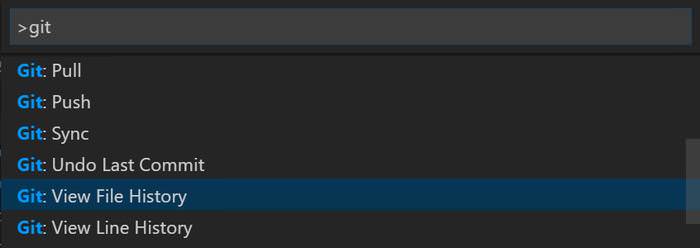
You can access the commands related to Git History if you type the word “Git” into the Command Palette (F1), choose “Git” inside the dropdown list, and finally select the command you need. Note that you need to open the file of which you want to see the history before you can perform any actions on it.
